After a long range of posts about water samples, I gathered my first set of soil samples in the wood.

Water samples are so much easier than soil samples, because they can be measured right away and then water is mixed well, although it’s not completely homogeneous as we saw earlier.
Now it was time to practice with soil samples and investigate all the different methods used in labs all over the world. Of course I’m still concentrating on pH and conductivity. The analysis of salts will come later.
In the Southern part of the “Spanderswoud in the middle of the Netherlands, I took two samples at two locations each, close to two different posts indicating a walking route (numbers 10 and 21). Four samples in total and although this sounds like duplicate sampling, soil does not really mix, so the results can be very different and actually it is better to mix a large number of samples for one location to avoid incidental anomalies. In this case I wanted to know the similarities and differences, so I kept the four apart and split the samples for different kinds of treatments.
First, I split each sample into halves. One half was left to dry in the air for about two hours and later they were sieved though a rather coarse net (openings about 2 mm). The remaining pieces were discarded. By the way, I used a kitchen scale to obtain the right portions.
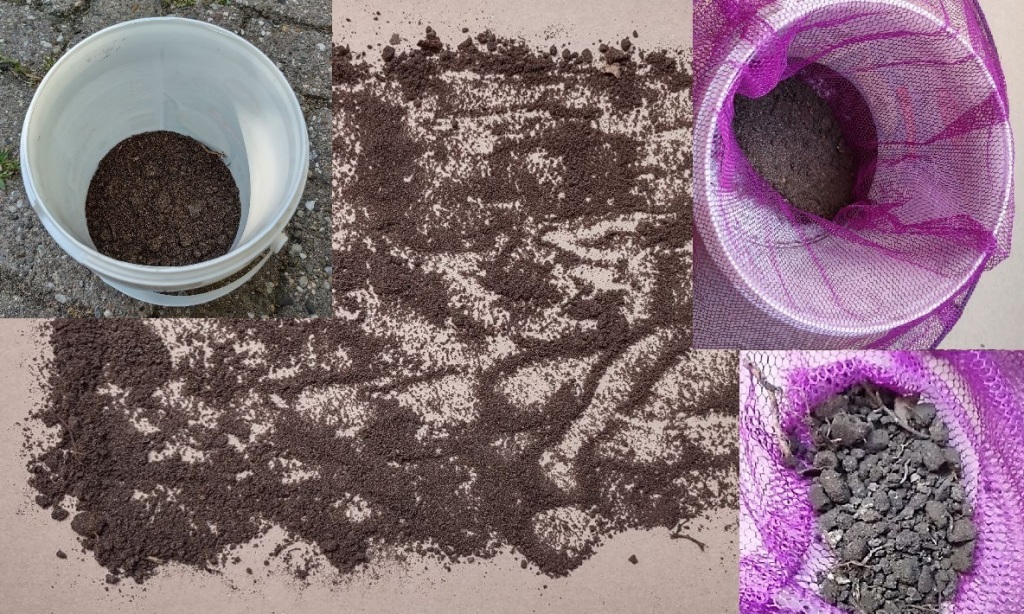
During the drying process the other half was split again (except for on sample, which turned out to be rather small).
The two quarters were treated differently. The first ones were mixed with an equal weight of water, but then I noticed the slurry was too thick to put even an instrument in, so I switched to a ratio of 2:1 adding the same amount of water again. This time it was more fluid, but my attempt to filter it was a bit pathetic, because nothing happened. The filter, although rather porous, was clogged immediately! Fortunately I only tried to filter the first one and still I managed to measure the slurry in the filter once, but most likely it was already compromised by the filter as I discovered later on.

The 2:1 water to soil sample slurries were measured in two rounds, both for pH and conductivity. I also noticed that the fluid on top had a higher pH value than the slurry at the bottom of the cup. That’s probably why it is advised to put the pH meter in the slurry [page 14]. At the same time the conductivity would go down, probably because a lot of sand is present in the slurry, increasing the electrical resistance! Apart from the two normal pH measurements I also did a single observation pushing the pH meter into the slurry.
The second quarter of the sample was mixed with a 0.01 M CaCl2 solution. In a previous post I told about the pH being completely unchanged and it was still the same as demineralised water: slightly acidic, with a pH of about 5.85. However, mixing it with the soil sample in the same 2:1 ratio, the pH of the mixture turned out to be much lower than for the demineralised water. This is a known effect [the addition of the salt does lower the pH by
about 0.5 pH units compared to soil pH in water (Schofield and Taylor 1955; Courchesne et al. 1995)] Of course the conductivity wasn’t measured now, because the CaCl2 would mask everything.
Then I went on with the dried and sieved samples, mixing them with demineralised water only (2:1 weight/weight again). Again the pH and conductivity were measured in two rounds and then I doubled the weight by adding more (demineralised) water, basically creating a 5:1 mixture.
Two more rounds of measurements followed – again with an additional series of pH measured in the slurry. If no buffering capacity was present in the soil, the addition of more water would increase the pH by 10log(2) or 10log (2.5), depending on how the soil itself will count (as a volume or not – probably in between). This would be an increase in the pH of 0.3 – 0.4.

Finally I tried and filtered the 5:1 slurry and took additional measurements for pH and conductivity. Neither filtering nor measuring the filtrate were a great success. Although I used a rinsed filter, the pH still went up. Later I started thinking that it’s probably not some kind of substance in the filter, but a property of the paper ad- or absorbing (H+) ions. For now that’s all about the methodology. Next time I will present the results and my conclusions.
