The title looks simple, but at the same time it’s a difficult one. Of course I haven’t been looking at the trees and other plants, because it’s all about the soil. Then I wondered whether I should talk about woods or forests. To me a limited area with trees won’t be qualified as a forest, but the FAO seems to be quite tolerant.
Some time ago I did several experiments with soil from the Spanderswoud (near Bussum), which turned out to be very acidic (pH 4 or less). This time I visited the forest to the North of Austerlitz in the Netherlands, a modest wood near Winterswijk, close to the river Slinge and a spot at the Holterberg. To get an impression about the soil I collected samples from an area of about ten metres along a path (actually two different ones for Austerlitz) and combined them in a bottle. Again the samples were superficial – between 5 and 10 cm deep. Later on we’ll probably look at deeper soil.
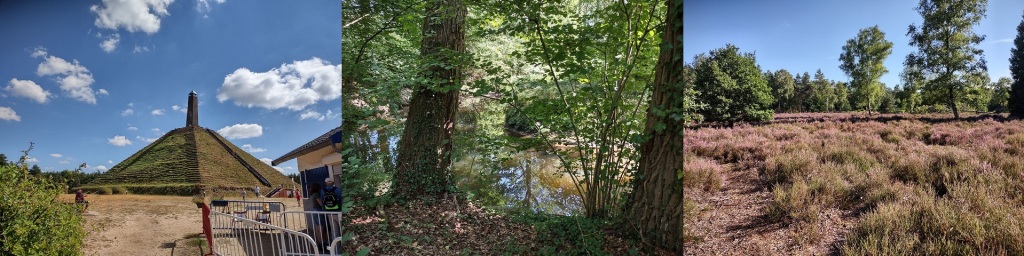
(left one manipulated, because people could be recognised).
Although the woods in Almere (formally also forests) were rather basic, this was probably because the soil is heavy clay. The three locations investigated this time, all had sandy soil mixed with humus. The top layer of dead organic material was scraped of before sampling, but still a lot of organic material was in. As learnt from previous experiments the soil was air-dried first and investigated without sieving (except for removal of stones and large pieces of wood).
Spoiler alert: all pH values were below 4!
For each sample-set (remember that between five and ten samples over a distance of ten metres were combined in a single bottle) two slurries were made out of 30 grams of soil with 30 grams of demineralised water.
Although sometimes the slurry was really compact, it was possible to measure both pH and conductivity. Each slurry was measure three times. The first round was for the pH, then one for conductivity and so on. Taking two slurries is a necessary approach, because not all the samples were very homogeneous. It’s not easy to have the same balanced combination the sandy and organic fraction every time. For the pH this is not very important, it seems, but the conductivity is very sensitive to different compositions. It was really interesting to see that a rather solid slurry could have a higher conductivity than a more fluid one.
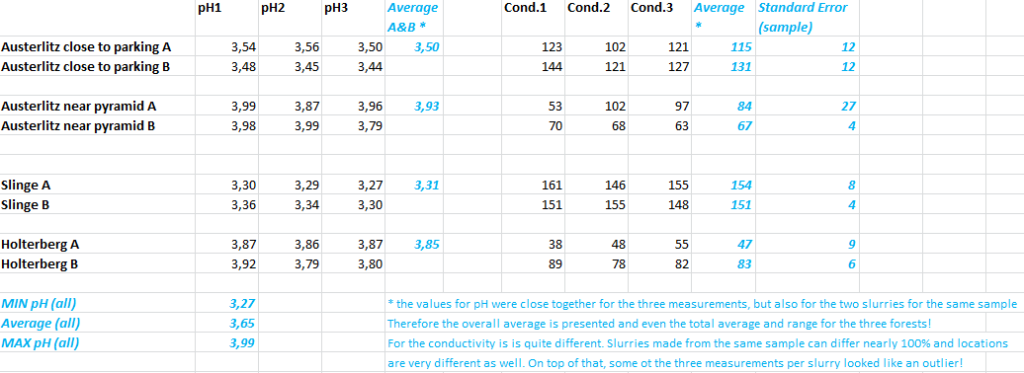
This time I will present the actual values measured. The pH meter was checked with the buffers before and after. If the deviation became too large (e.g. over 0.05), a calibration was performed (beforehand of course, not afterwards). Usually some drift is observed – also depending on the temperature – but the values stay close to the real values, so the measurements are reliable.
The Spanderswoud is left out, because there we used a 1:2 mixture of soil and water and the measurements were only done twice. The latter is not an issue, but different dilutions will lead to different values for both pH and conductivity.
Doing statistics, there is a complication. The three measurements for the same slurry will be correlated closely, but the two slurries derived from a single sample-set are correlated as well. We can’t simply assume that we are dealing with six different observations of equal weight. Yet the pH values were very close together – even so close that we present an average, minimum and maximum for the total values of all the locations. The individual values are also shown in a bar-graph.

For the conductivity the pattern is less consistent. When a sample-set has both sandy soil and organic matter it is hard to take a representative sample from it. As a result the two slurries made out of the same sample-set got very different conductivities. Then different attempts to determine the conductivity in a single slurry can also differ a lot. This can be seen very clearly in the bar-graph.

Stepping back, the conclusion is that the three locations have a very low pH, meaning a lot of acid is present. This is something the Netherlands are struggling with indeed. The conductivity is less uniform, meaning the content of soluble salts is quite different for the locations. A lot of nettles and blackberries were present, especially in Winterswijk, near the Slinge.
