Before presenting additional water samples, I really wanted to present another set of soil samples. The very acidic soil (pH as low as 3.5) in the wood (Spanderswoud, near Hilversum) was a surprise and I wanted to check the agricultural soil in our “new land”. New land basically means that it’s the bottom of a former sea. When the “polder” was created by pumping the water out of the area, the salt had already been washed out, because the “Afsluitdijk” was put in place first, changing the former sea into a freshwater lake. Therefore I didn’t expect a high conductivity as a result of the seawater once flowing here, although fertiliser might be influential.
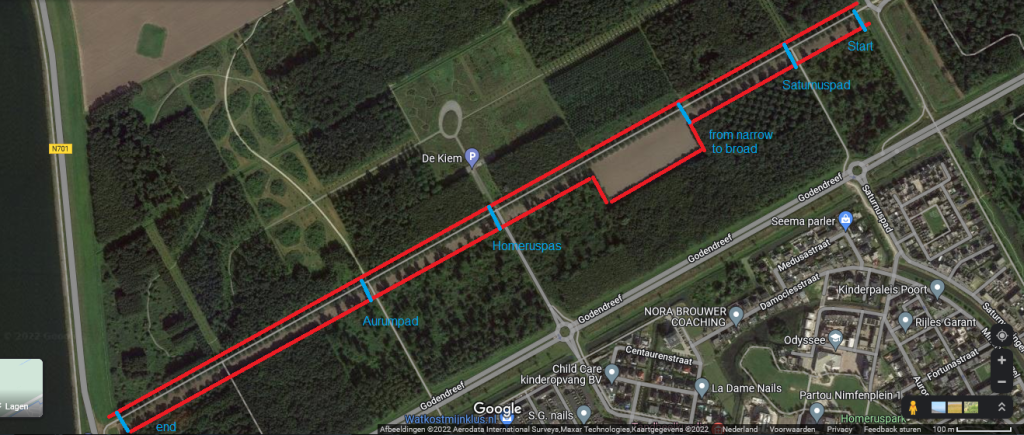
In Almere there is a very elongated field next to the “van Wagtendonkpad”. The field is over 1.5 km in length, but rather narrow (about 25 metres wide). At one place it is suddenly broader, nearly 90 metres (I measured the sizes at Google maps to be sure).

Because of the very long stretch it seemed a nice field to investigate. Most likely it belongs to one farmer of at least it’s worked by the only one farmer. Previously onions were bred. I decided to sample at start, end and some spots in between, where paths were crossing. The land was freshly ploughed by the look of it and looked like heavy clay, with lumps of half a metre! The sample drill was of no use, because I could get it in only 10 cm and then the sample would not come out, so I started collecting smaller lumps (3-5cm) perpendicular to the length, from front to rear at each single location. This worked rather well.
At home I investigated the soil and it seems to be silty clay.

As a reference I cycled a little bit further to the north and collected samples in a potato-field. This time I used my sampling drill, but only superficial (soil was still very compact) and in the between the potato beds as much as possible. Although the structure of the field looked quite different, the soil turned out to be clay after all.

At home I dried the lumps to the air and crushed them all to smaller pieces (3-5 mm) and powder. The five sample locations were investigated separately. The soil from the potato-field was already fine-grained. The samples were (air) dried for about 2 hours, but not sieved yet.
(After several hours of additional air-drying, samples from the same field were sieved, mixed thoroughly and kept in a bottle. Two days later an additional set of measurements was performed on the samples of the two fields.)

Taking 40 grams of all the samples, I decided to add only 40 grams of water, obtaining a 1:1 mixture. It was possible to determine both pH and conductivity in the slurry.
After two rounds of measurements, a single drop of a 0.755 M CaCl2 solution was added to the slurries. This could cause the CaCl2 concentration to get up to 1 mM and I was curious to see what would happen to the pH. Then I added 0.5 ml of the same stock-solution, raising the CaCl2 concentration close to 0.01 M (10mM), to see whether the pH would drop with half a point indeed (as stated in the literature quoted previously) .
(I also determined the conductivity to see whether it would be close to the value of the 0.01 M solution, but is was lower than calculated and much more different than the error of less than 10% would explain. It’s not clear why).
To cut a long story short: throughout the field the pH and conductivity values were very, very similar.

Adding 0.5 ml of 0.755 M CaCl2 solution to the slurry holding 40 grams of water, caused the pH to drop about half a point indeed (range 7.47 – 7.52)! Those values are not shown in the graph.

The conductivity values presented are for the 1:1 soil water slurry. Of course the values after adding Calcium Chloride are left out, because then the conductivity was increased artificially (to the range 1531 – 1868).
Actually the pH and conductivity values were a surprise, as they were completely different from the ones for the soil samples taken in the wood.
Here all pH values were above 7, meaning they were at the alkaline side rather than acid. I already noticed a lot of shells were in the soil. Not surprising for the bottom of a former sea of course, but the calcium compound might be able to absorb acid. Then the conductivity was much higher than for the samples from the wood. The 99% confidentiality interval for the population was 239 – 383 The range was mainly this broad because one location was an outlier. Why? I wouldn’t know (I certainly was not eating crisps while working with the samples!). The range is still very different from the low values in the woods (those were twenty times lower, for the sandy soil with humus). The values were also very different from the lakes in Flevoland (three times higher), but that’s comparing apples and oranges of course.
The potato-field, despite the very different macroscopic structure had more or less the same values for pH and conductivity.

The question is how influential the use of fertilisers may be. For comparison samples can be taken from the recreational wood to the other side of the van Wagtendonkpad. But the next update will be about the samples after additional drying, sieving and combining all samples at field-level. Then we will present another river.
